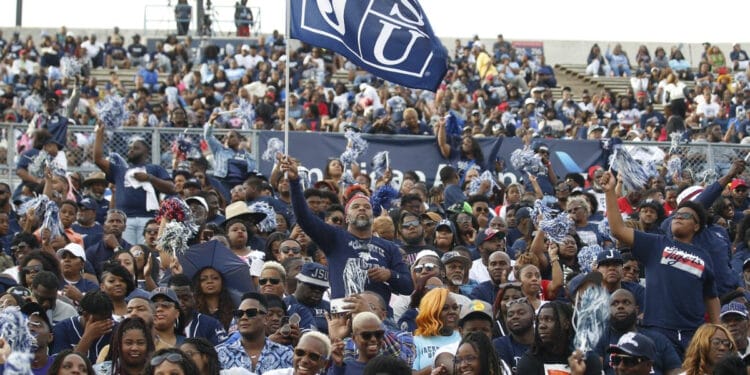
Jackson State once again is the FCS leader in average home attendance, drawing 30,000 fans. This is a dip from the 42,000 average attendance in 2022, but JSU’s streak at No. 1 continues.
Other familiar names are at the top. Montana and Montana State own the No. 2 and 3 spots as they did last year.
A big riser is Tarleton State as it continues its transition from D2. Tarleton went from No. 16 last year to No. 4 this fall. SDSU rose from No. 10 to No. 5.
Here are the average home attendance figures for all FCS teams.
Figures are via the NCAA and through 11/18 games. They do not include FCS playoff games.
% is percentage capacity of the stadium
| Rank | Avg | % |
| 1 Jackson St. | 30,060 | 75.1 |
| 2 Montana | 26,269 | 104.1 |
| 3 Montana St. | 21,610 | 121.5 |
| 4 Alabama St. | 19,690 | 74.3 |
| 5 Tarleton St. | 18,697 | 77.9 |
| 6 SDSU | 18,208 | 94.1 |
| 7 FAMU | 17,616 | 89.7 |
| 8 Southern | 17,465 | 61.2 |
| 9 Norfolk St. | 15,656 | 52.1 |
| 10 Delaware | 15,564 | 86.1 |
| 11 NDSU | 15,121 | 80.8 |
| 12 Sac St. | 13,348 | 62.9 |
| 13 Alabama A&M | 12,934 | 61.59 |
| 14 Alcorn | 12,018 | 53.4 |
| 15 WCU | 11,935 | 86.5 |
| 16 Idaho | 11,737 | 73.3 |
| 17 EKU | 11,655 | 58.2 |
| 18 Yale | 11,581 | 18 |
| 19 Harvard | 11,555 | 38.1 |
| 20 The Citadel | 11,005 | 95.7 |
| 21 SC St. | 10,661 | 48.4 |
| 22 UC Davis | 10,562 | 97.3 |
| 23 Furman | 10,467 | 65.4 |
| 24 UND | 10,288 | 83.7 |
| 25 W&M | 10,268 | 88.1 |
| 26 YSU | 10,065 | 48.7 |
| 27 Mercer | 9,741 | 95.5 |
| 28 Murray St. | 9,645 | 60.2 |
| 29 NC A&T | 9,582 | 44.5 |
| 30 North Ala. | 9,494 | 66.7 |
| 31 UNI | 9,379 | 57.4 |
| 32 Missouri St. | 9,143 | 52.2 |
| 33 NC Central | 9,055 | 90.5 |
| 34 McNeese | 8,840 | 49.6 |
| 35 UNH | 8,716 | 79.1 |
| 36 Holy Cross | 8,344 | 35.5 |
| 37 Austin Peay | 8,309 | 83.1 |
| 38 Chattanooga | 8,177 | 39.5 |
| 39 Weber St. | 8,155 | 49.8 |
| 40 SFA | 8,100 | 55.5 |
| 41 Tennessee Tech | 8,021 | 48.6 |
| 42 Elon | 8,008 | 71.1 |
| 43 ETSU | 7,990 | 103.8 |
| 44 Kennesaw | 7,857 | 94.6 |
| 45 UAPB | 7,761 | 53.5 |
| 46 SIU | 7,544 | 50.2 |
| 47 Hampton | 7,431 | 61.9 |
| 48 Texas Southern | 7,422 | 33.7 |
| 49 Cal Poly | 7,392 | 66.7 |
| 50 Northern Ariz. | 7,235 | 72.3 |
| 51 Idaho St. | 7,226 | 60.2 |
| 52 Illinois St. | 7,194 | 53.7 |
| 53 Abilene Christian | 7,090 | 78.7 |
| 54 Central Ark. | 7,048 | 70.4 |
| 55 Morehead St. | 6,980 | 69.8 |
| 56 South Dakota | 6,890 | 75.7 |
| 57 Stony Brook | 6,477 | 52.6 |
| 58 Bethune-Cookman | 6,398 | 66.6 |
| 59 Sacred Heart | 6,346 | 158.6 |
| 60 Grambling | 6,170 | 31.4 |
| 61 Richmond | 6,165 | 70.8 |
| 62 Prairie View | 6,062 | 40.4 |
| 63 Princeton | 5,882 | 19.6 |
| 64 Lehigh | 5,851 | 36.5 |
| 65 SEMO | 5,732 | 57.3 |
| 66 MVSU | 5,692 | 54.2 |
| 67 EWU | 5,678 | 66.1 |
| 68 EIU | 5,672 | 56.7 |
| 69 Lamar | 5,643 | 35.2 |
| 70 Samford | 5,618 | 83.8 |
| 71 Nicholls | 5,614 | 53.4 |
| 72 UAlbany | 5,558 | 65.3 |
| 73 Cornell | 5,509 | 25.6 |
| 74 Penn | 5,474 | 10.3 |
| 75 Howard | 5,433 | 76.6 |
| 76 Tex. A&M-Commerce | 5,420 | 54.2 |
| 77 Tennessee St. | 5,400 | 8 |
| 78 Maine | 5,138 | 51.3 |
| 79 Rhode Island | 5,135 | 99.3 |
| 80 Utah Tech | 5,132 | 51.3 |
| 81 Morgan St. | 5,075 | 50.7 |
| 82 Delaware St. | 5,009 | 71.5 |
| 83 Northwestern St. | 4,915 | 30.7 |
| 84 VMI | 4,854 | 48.5 |
| 85 UT Martin | 4,831 | 64.4 |
| 86 Gardner-Webb | 4,827 | 56.7 |
| 87 Villanova | 4,676 | 38.9 |
| 88 Merrimack | 4,505 | 128.7 |
| 89 Columbia | 4,366 | 25.6 |
| 90 Campbell | 4,214 | 76.6 |
| 91 Davidson | 4,166 | 92.5 |
| 92 Indiana St. | 4,088 | 32.1 |
| 93 Wofford | 4,019 | 30.9 |
| 94 SUU | 4,011 | 47.1 |
| 95 Dayton | 3,964 | 36.1 |
| 96 SLU | 3,944 | 53.3 |
| 97 St. Thomas | 3,868 | 76.9 |
| 98 Lafayette | 3,795 | 28.9 |
| 99 Towson | 3,783 | 33.7 |
| 100 Brown | 3,765 | 18.8 |
| 101 CSU | 3,684 | 92.1 |
| 102 N. Col. | 3,648 | 42.9 |
| 103 Butler | 3,595 | 63.6 |
| 104 CCSU | 3,574 | 64.9 |
| 105 Lindenwood | 3,280 | 54.6 |
| 106 Dartmouth | 3,153 | 28.6 |
| 107 WIU | 2,915 | 17.8 |
| 108 Colgate | 2,878 | 28.1 |
| 109 Monmouth | 2,842 | 67.6 |
| 110 Georgetown | 2,734 | 109.3 |
| 111 Portland St. | 2,636 | 36.6 |
| 112 Fordham | 2,548 | 36.4 |
| 113 Drake | 2,481 | 17.04 |
| 114 UIW | 2,386 | 39.7 |
| 115 Robert Morris | 2,242 | 74.7 |
| 116 Marist | 2,096 | 41.9 |
| 117 Duquesne | 1,822 | 82.8 |
| 118 Stonehill | 1,806 | 75.2 |
| 119 HCU | 1,797 | 35.9 |
| 120 Valparaiso | 1,778 | 35.5 |
| 121 Bryant | 1,725 | 39.2 |
| 122 Saint Francis | 1,646 | 47 |
| 123 LIU | 1,565 | 22.3 |
| 124 Stetson | 1,442 | 24. |
| 125 Bucknell | 1,281 | 9.7 |
| 126 San Diego | 1,278 | 22.1 |
| 127 Presbyterian | 1,254 | 19.3 |
| 128 Wagner | 872 | 26.4 |

